
From design, to data, to agents.
Azmir Wazed Murad. Analytics Engineer, based in Dhaka, Bangladesh.
t to switch theme
I translate. Someone asks a question, and I turn it into a number they can trust, designed so it is understood at a glance, with a model, a pipeline and, lately, a few agents in between.
I started as a designer, making charts for people who did not want to read spreadsheets. It left me with the rule I still build by: a visual is a sentence, so make it say one thing clearly.
Curiosity then pulled me down the stack, from the chart to Power BI, to the semantic model, to Microsoft Fabric underneath. Each layer I learned made the one above it better.
Now there is a new layer on top. I write the contract, an agent writes the code, and a test proves every number before anyone sees it. The designer’s questions never left: why, how, and who is this for?
This site was built that way too.
Experience
Bash(git log --working-now/)
7 burning · 18 sleeping · pid is yymm, when it last ran
18 sleeping processes, earlier work
Bash(git log --career-graph/)
7 commits · 2017 → now · newest first, open any one for the diff
bc2451aAnalytics EngineerHEAD → nowclient delivery · Microsoft Fabric & Power BIJan 2025 · present1 yr 10 mos
- End-to-end analytics on Microsoft Fabric: lakehouses, pipelines and notebooks feeding the semantic models and reports people use.
- Took analytics past the dashboard with data agents and Fabric data apps, so people can ask questions and use tools, not only read charts.
- Model work at enterprise scale: designing, consolidating and migrating models so the numbers hold up under real use.
- Source-controlled delivery with PBIP and TMDL in Git, promoted through environments by pull request.
- Report design systems that keep every dashboard consistent, now packaged as skills an agent can follow.
- Moved to agent-first development: I write the contract, agents build, tests prove it. The step from analyst to engineer.
- DP-700 completed the set of three Microsoft associate certifications.
5c97960Junior Data Analyst, Power BIclient delivery · Power BIApr 2024 · Jan 202510 mos
- Dashboards and reports for business users, built around the decisions they make.
- The modelling underneath in Power Query and DAX, where I learned that the model matters more than the visual.
- DP-600 and the first steps down the stack into Fabric.
28cbee4Data Analyst Internclient delivery · Power BIJan 2024 · Mar 20243 mos
- Data preparation, report building and testing on real delivery work: the bridge from practice projects to production.
- PL-300, the first Microsoft certification.
185fff4Data ArtistAdiva GraphicsMar 2023 · Oct 20238 mos
- Presentation-ready charts for client deliverables, with every number checked before it left the studio.
- Where the rule I still build by came from: a visual is a sentence, it should say one thing clearly.
a1eb10aData Analyst, virtual internshipPwC job simulationJan 20231 mo
- Dashboard simulations for a business audience: the first time analysis had to answer someone else’s question.
cf186beArticle Writer & Community ModeratorMultiversX · remoteAug 2022 · Mar 20238 mos
- Technical writing and community moderation: explaining complex things plainly, which is still half the job.
f853b4eB.Sc. in Computer Science & EngineeringrootPort City International University2017 · 20214 yrs
- Where the engineering came from. Design, data and agents were all built on top of it.
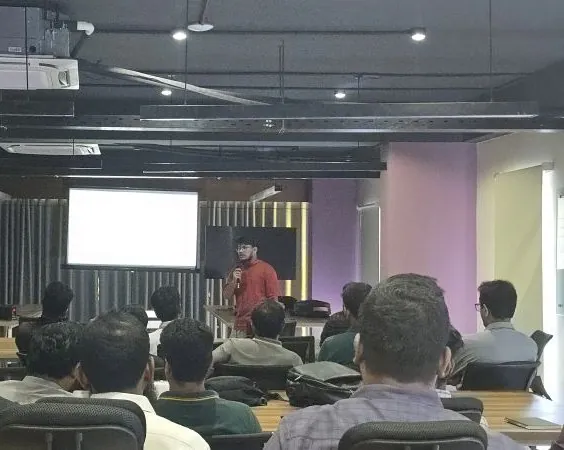
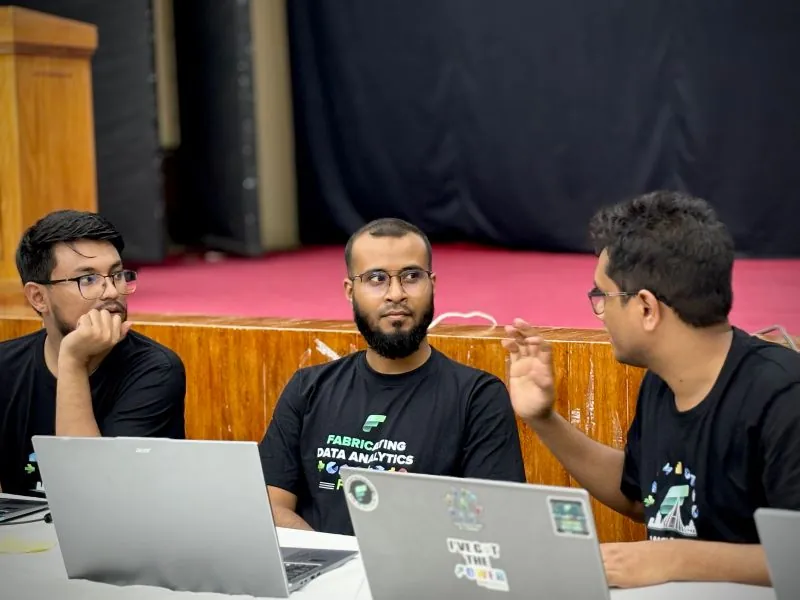
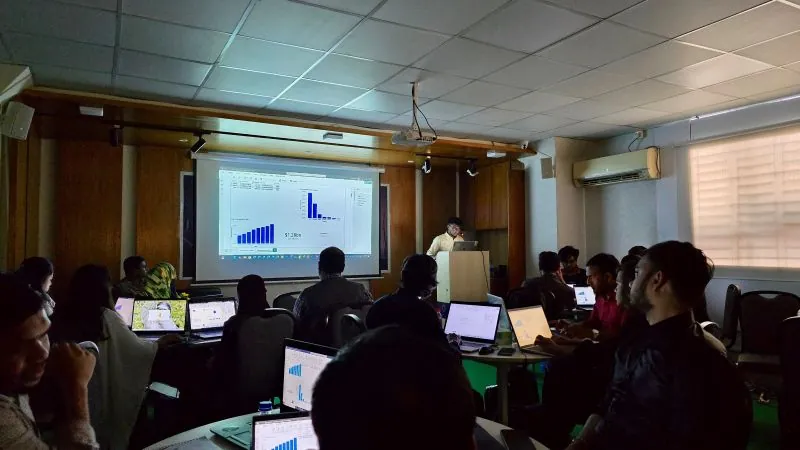
Speaking & community
Bash(ls ~/sessions/ --journey)
3 on stage · 1 moderated · 1 featured · newest first
 post ↗
 post ↗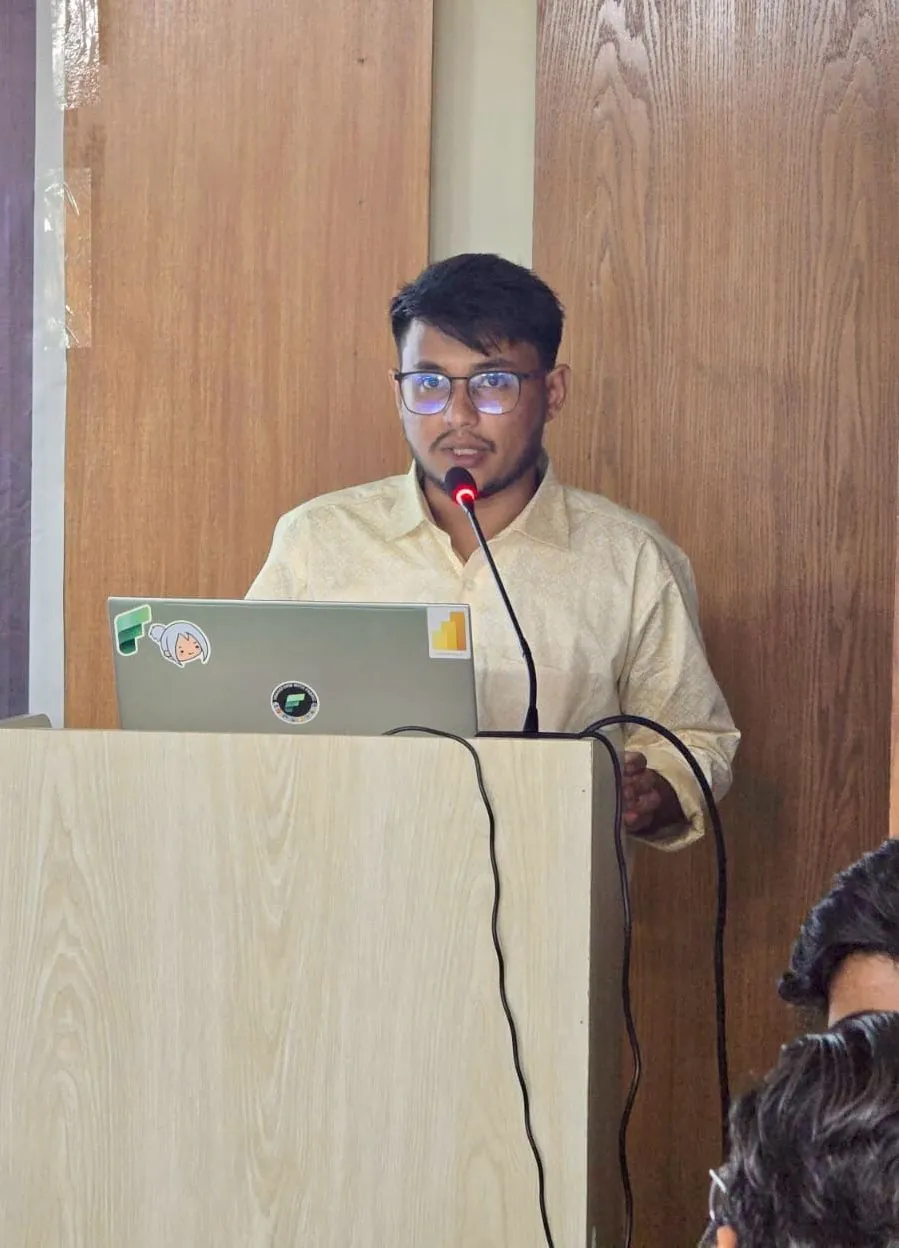
 post ↗
Certifications
associate · 3 of 3

Tools
Read(~/.awmium/toolchain)
22 tools, grouped the way I picked them up