
---
tags: [power-bi, operations, pwc]
stack: [power-bi, dax]
read: 1 min
---
Call Centre Trends
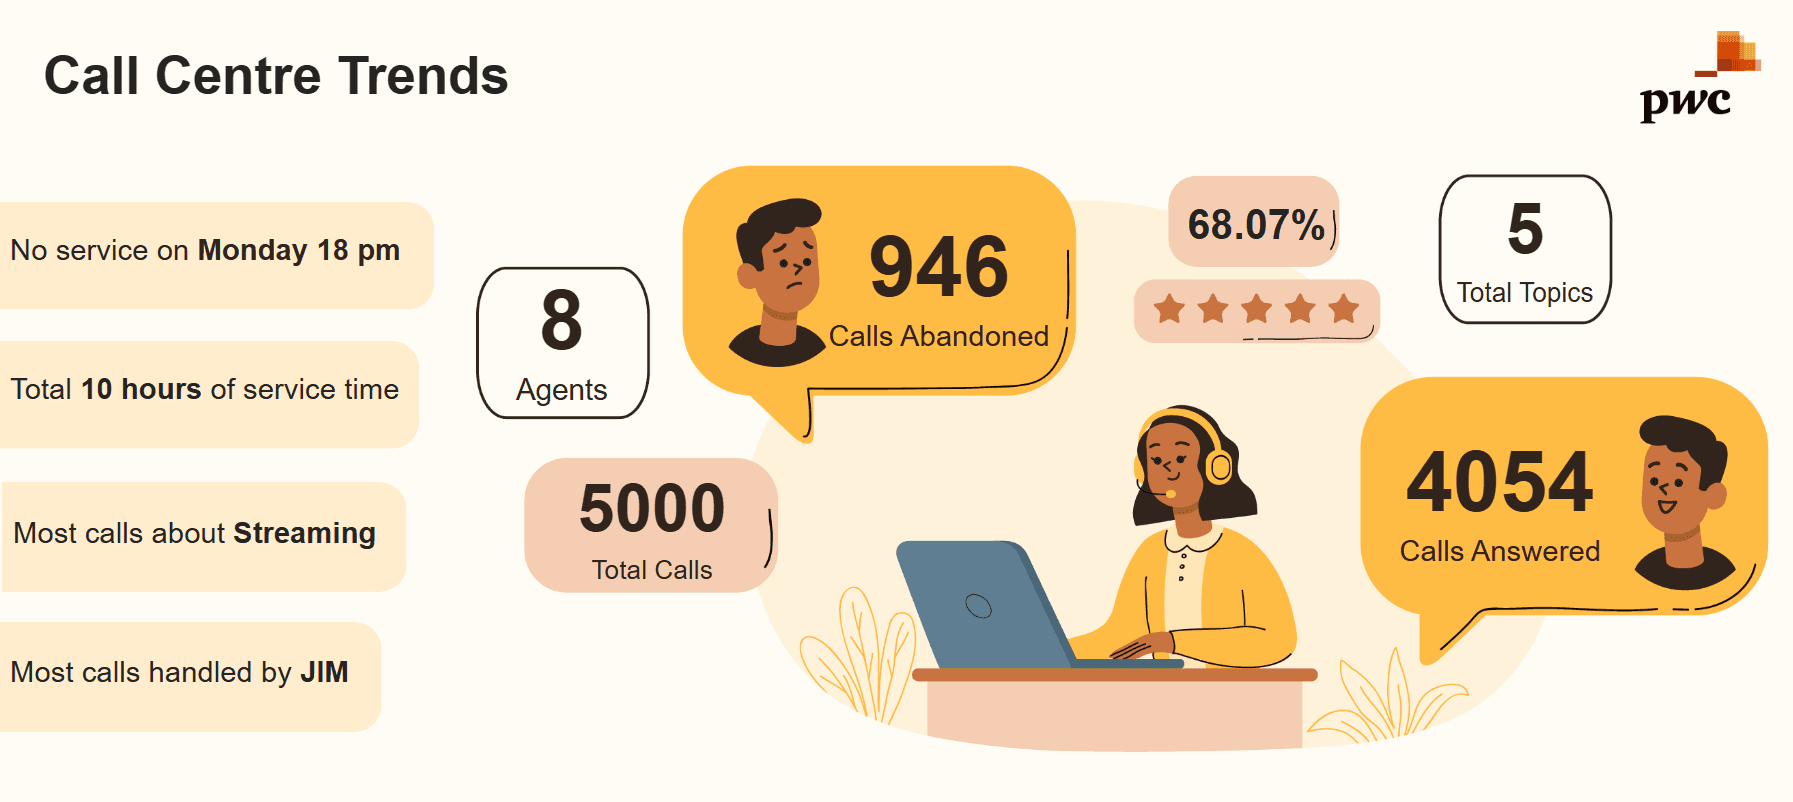
Built for PwC’s Power BI job simulation: one week of call centre data, 5,000 calls and 8 agents. The brief was to show the call centre manager where service was slipping, so the report opens with the findings rather than the charts.
What it found
- 4,054 of the 5,000 calls were answered and 946 were abandoned.
- There was no service at all on Monday at 6 pm, a hole in the schedule.
- Streaming was the most common call topic, and Jim handled the most calls.
The pages
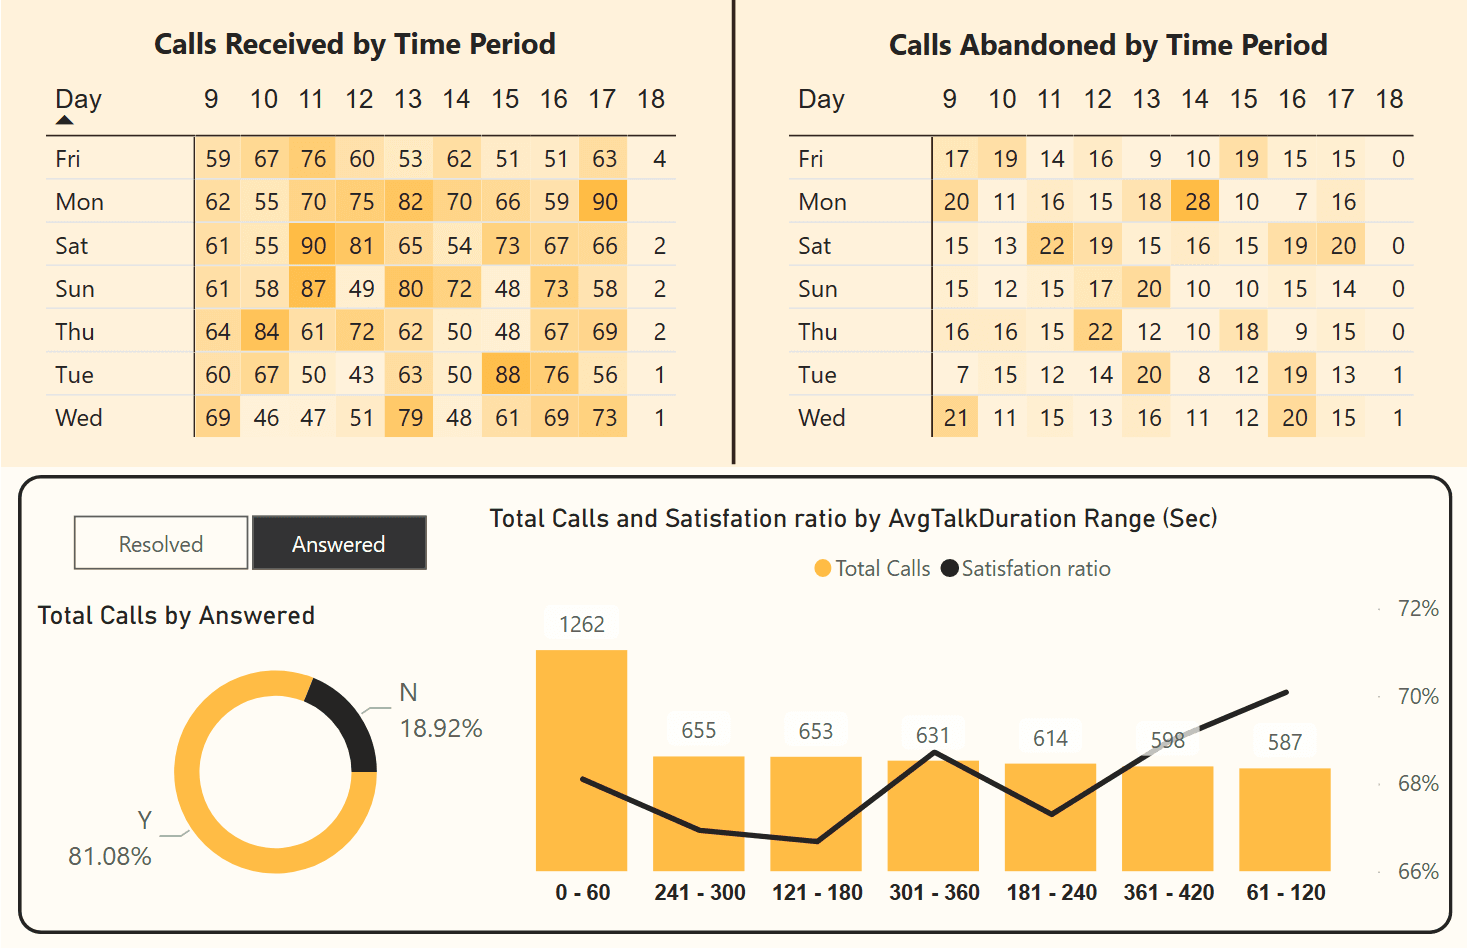
- A day-by-hour grid of calls received and abandoned. This is where the Monday gap shows up.
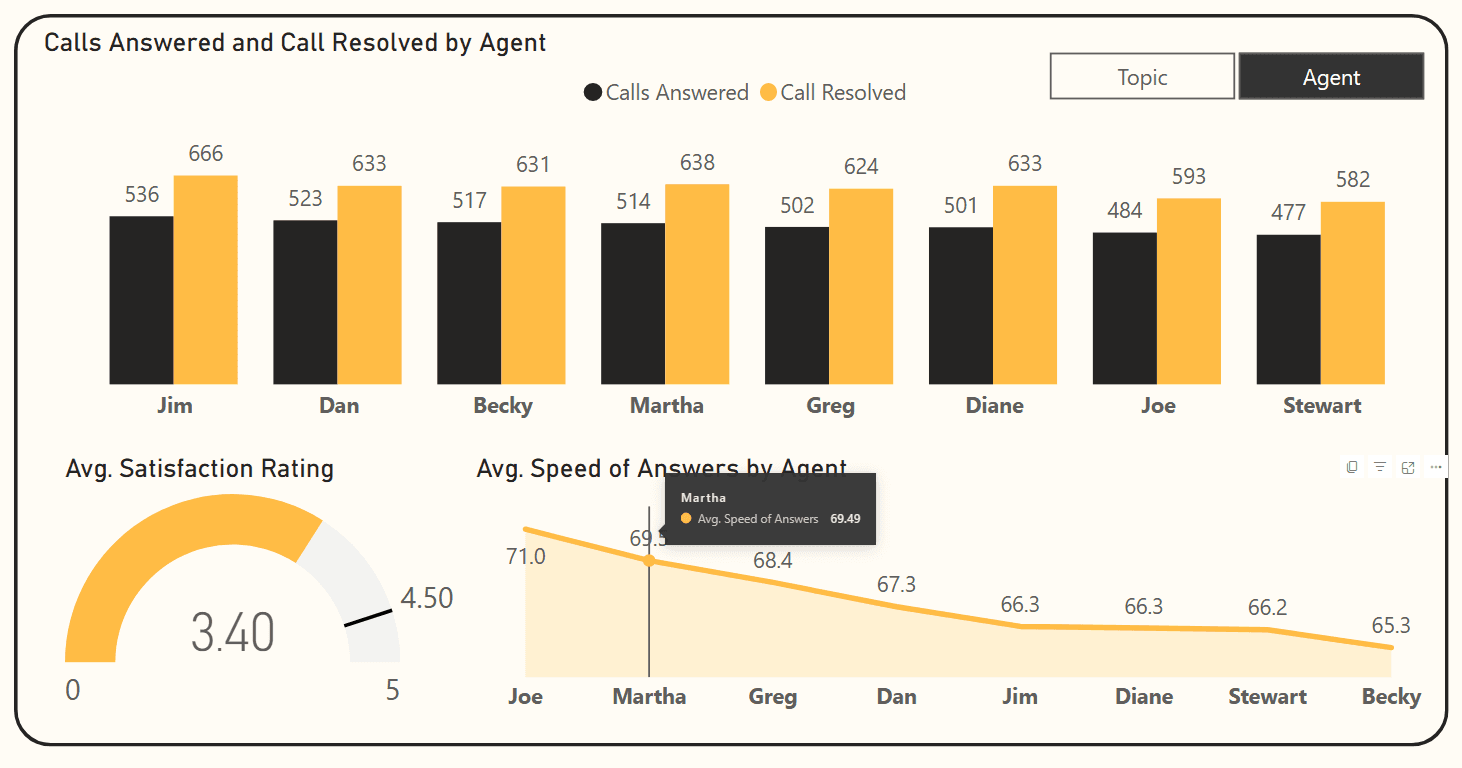
- Calls answered and resolved per agent, with the average satisfaction rating (3.40 out of 5) and speed of answer.
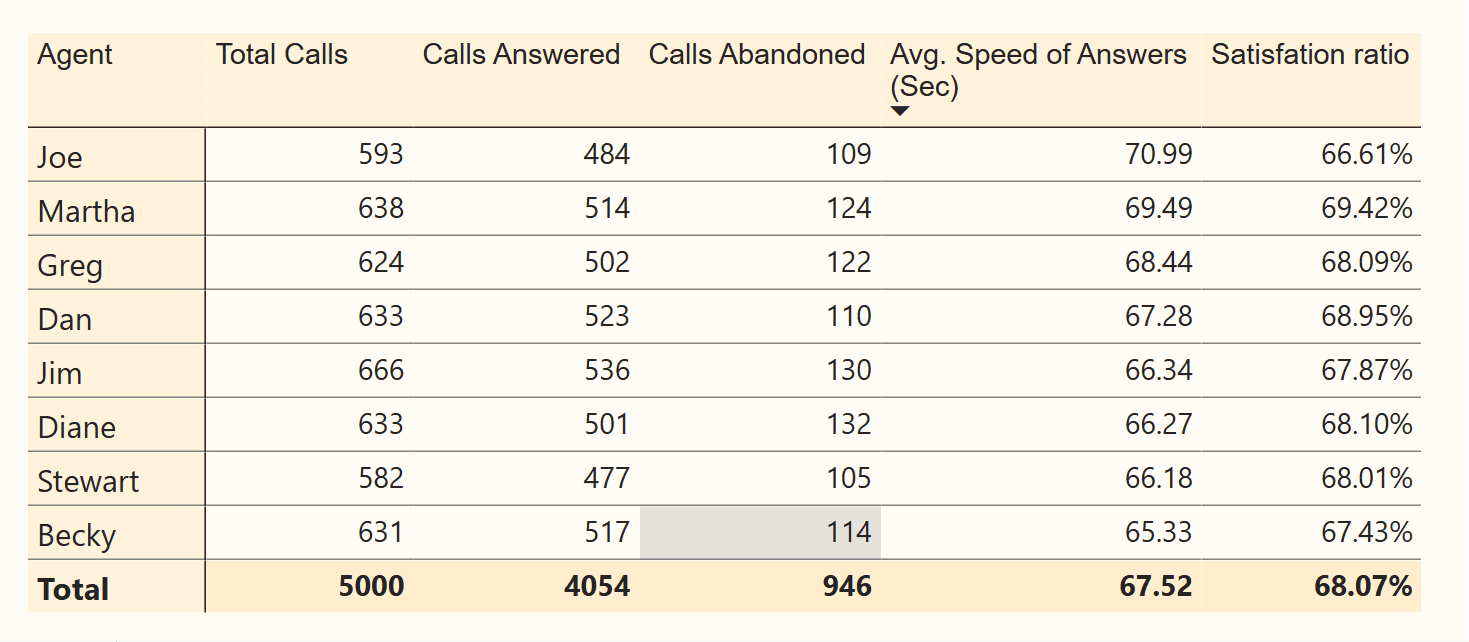
- An agent scorecard with total, answered and abandoned calls, average answer speed and satisfaction ratio.
read# Call Centre Trends[ ] sectionsTop