
---
tags: [power-bi, public-health, owid]
stack: [power-bi, python]
read: 1 min
---
OWID Covid-19 Report
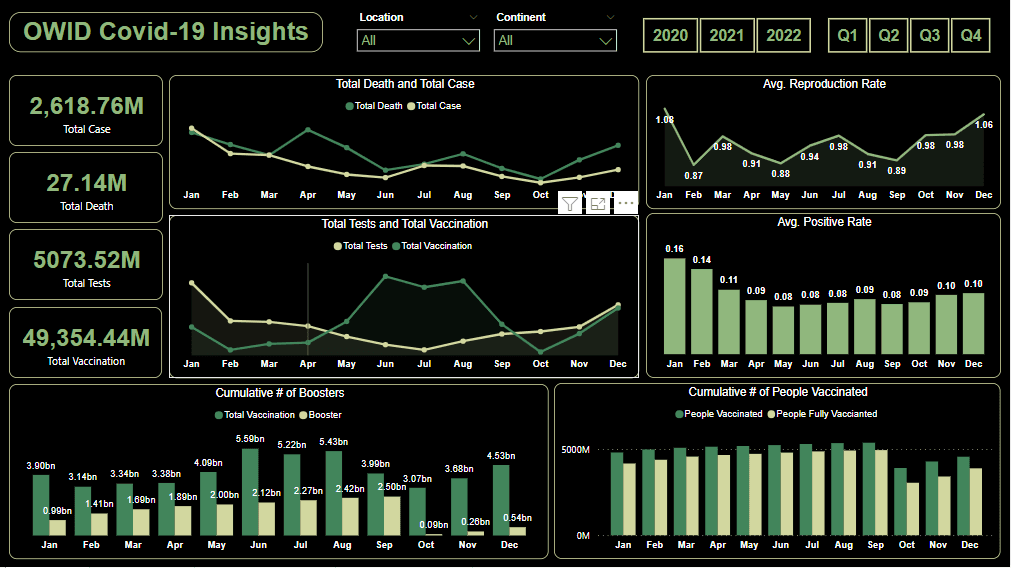
A one-page tracker built on Our World in Data’s COVID-19 dataset. I prepared the data in a Python notebook first, splitting the single wide file into separate tables a model can use, then built the report on top.
What it shows
- Cases, deaths, tests and vaccinations, each with its own trend.
- Reproduction rate and positivity rate over time.
- Vaccination and booster progress, cumulative.
- Filters for location, continent, year and quarter.
Why it matters
The source is one very wide file that changes constantly. Modelling it properly first is what makes a single page like this stay fast and readable.
read# OWID Covid-19 Report[ ] sectionsTop