
---
tags: [power-bi, retail, fp20]
stack: [power-bi, dax]
read: 1 min
---
San Martin’s Store
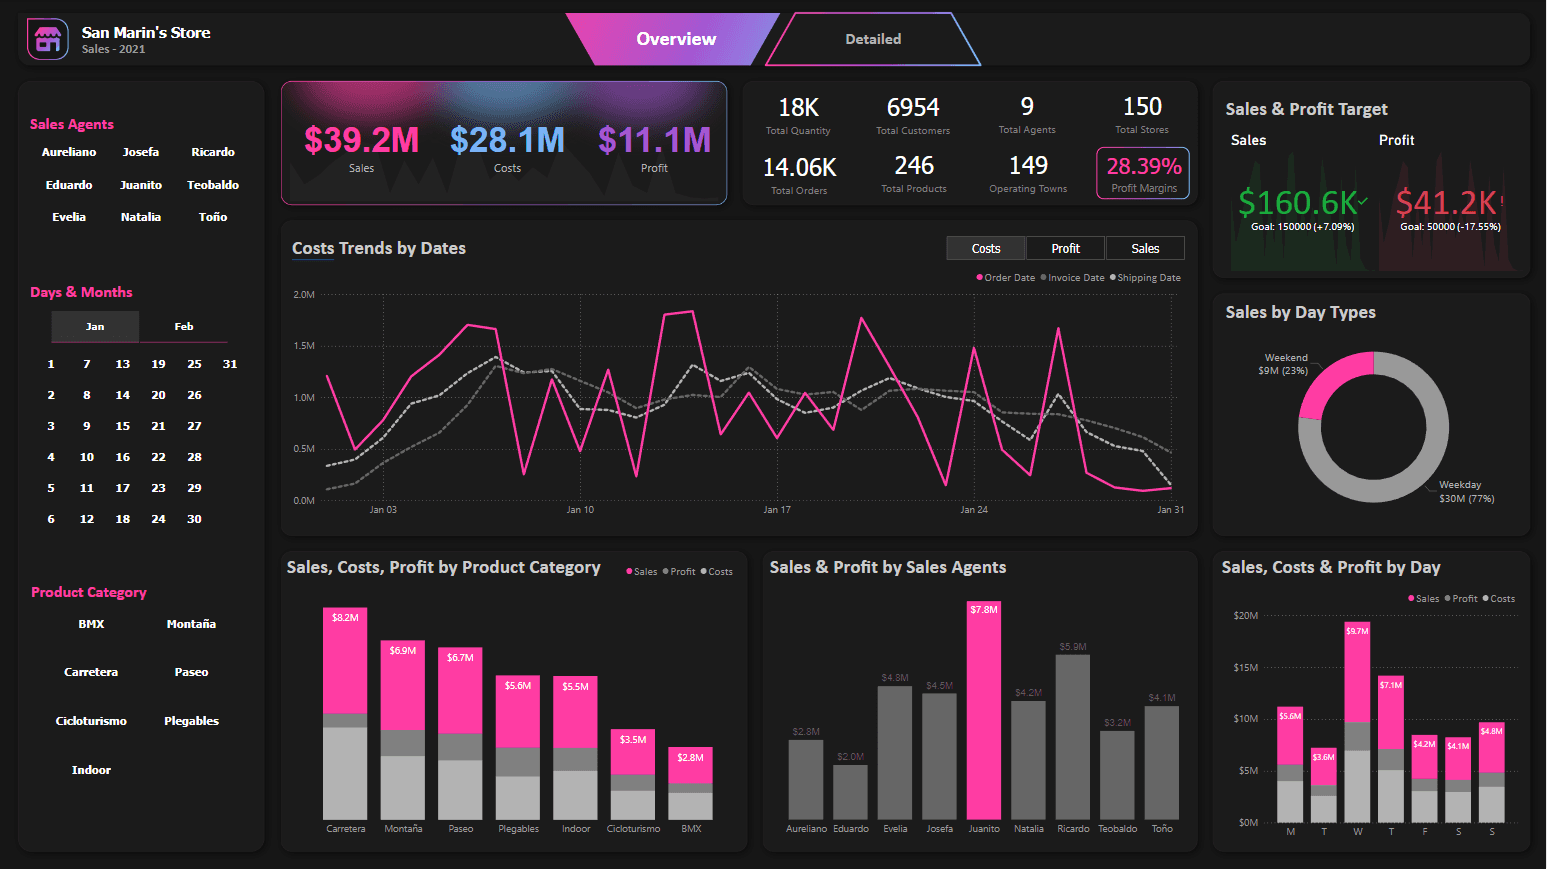
A two-page sales report for San Martin’s Store, a fictional bicycle retailer with 150 stores across Spain, built for an FP20 Analytics challenge on its 2021 data. The overview answers how the year went. The detailed page answers who sold it and where.
What it shows
- $39.2M in sales, $28.1M in costs and $11.1M in profit, a 28.39% margin, across 246 products and 149 operating towns.
- Sales and profit against their targets, with the variance right under each number.
- Cost, profit and sales trends by order, invoice and shipping date, switchable inside one visual.
- Weekday against weekend sales, and sales, costs and profit by product category, agent and day of the week.
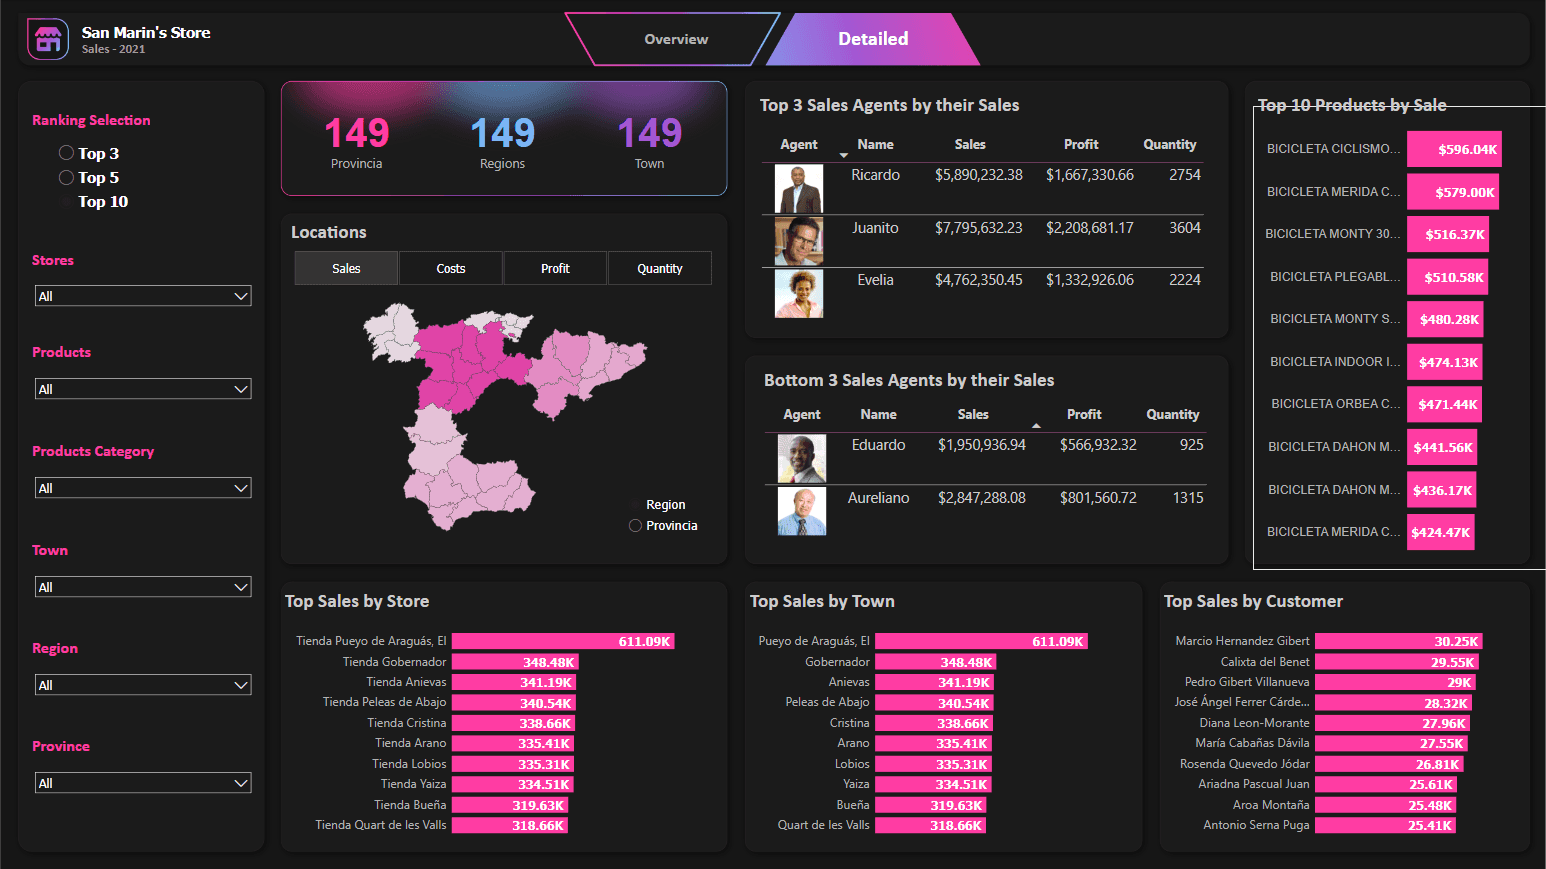
The detailed page
A Top 3, Top 5 or Top 10 selector drives everything on the second page: the best and worst sales agents (with photos), a map of sales by province and region, and ranked lists by store, town, customer and product. Same dark canvas, same pink accent, so the two pages read as one report.
read# San Martin’s Store[ ] sectionsTop