
---
tags: [power-bi, music, onyx-data]
stack: [power-bi, dax]
read: 1 min
---
Spotify Music Dashboard
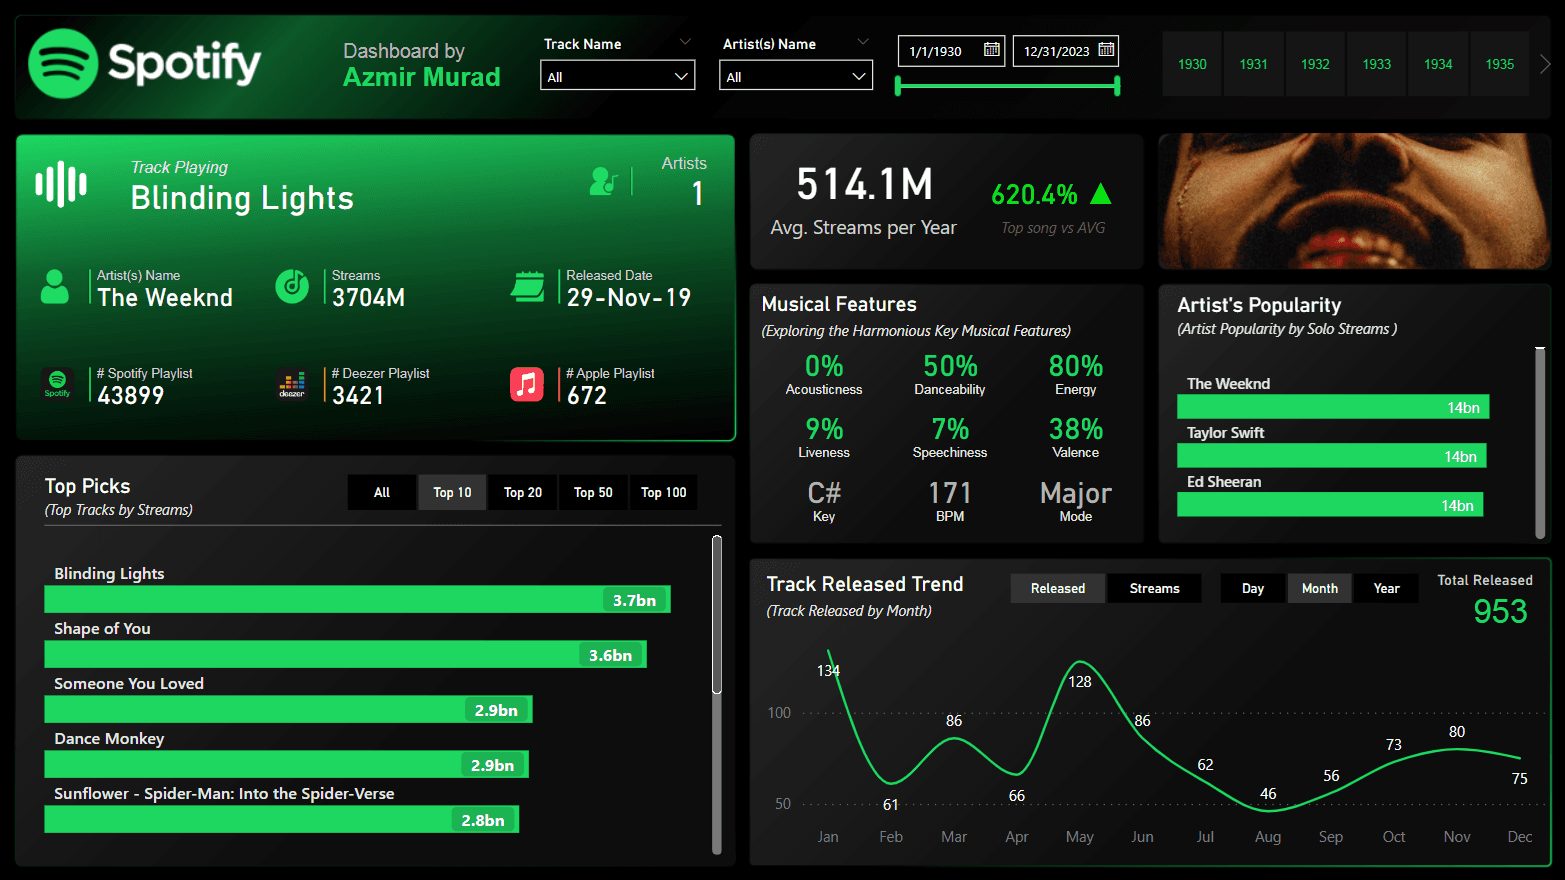
A one-page explorer built for Onyx Data’s DataDNA challenge (October 2023) on the most-streamed Spotify songs of 2023. Pick a track and the page rebuilds around it: its streams, its artist, and how it compares with everything else on the chart.
What it shows
- Total streams and average yearly streams, with the selected track measured against the chart average.
- Artist popularity and how often each artist releases.
- Musical features for the track, such as danceability and key, next to the chart-wide averages.
- Release trends by month and a ranked list of top picks.
Design notes
I borrowed Spotify’s own dark canvas and green so the report feels like part of the product it describes. Everything hangs off one selection, which keeps a page this dense readable: you only ever look at one song’s story.
read# Spotify Music Dashboard[ ] sectionsTop